November 2026 has quietly killed the metrics most brands still report on. Adam Mosseri has now confirmed the three signals Instagram actually ranks you by, and "total likes" is not one of them. Purple Crib Studios breaks down the new signal stack — sends per reach, watch time, and likes per reach — and the weekly audit that turns it into growth.
🚀 Ready to Make the Algorithms Work For You?
Purple Crib Studios builds signal-first social strategies for brands across the US, UK, UAE, Canada, and Nigeria — built on 2026 ranking data, not vanity metrics.
💬 Chat With Us on WhatsAppTable of Contents
- Why Your Likes Stopped Predicting Growth
- The Three Signals That Now Decide Reach
- Sends Per Reach: The Metric That Unlocks New Audiences
- Reach vs Engagement: Choosing Your Format on Purpose
- The 2026 Metrics Dashboard: What to Track Weekly
- The Signal-Over-Frequency Content Playbook
- 90-Day Signal-First Roadmap
- Quick Wins Checklist
- Test Your Knowledge — Quiz
- FAQs
1. Why Your Likes Stopped Predicting Growth
For a decade, social teams optimized the same dashboard: impressions, follower count, total likes, and post volume. That dashboard quietly stopped predicting anything in 2026. Platforms now rank content on what people do with it — share it to a DM, save it for later, or watch it to the end — not how many people scrolled past it.
The shift is structural, not a temporary algorithm dip. Instagram's head Adam Mosseri has spent 2026 publicly explaining that ranking reflects predicted engagement actions: how likely someone is to like, comment, send, or watch a post. Without ranking, Mosseri notes, feeds would be overrun by the accounts that post most often — which usually means brands — and the average creator's reach would shrink. In other words, volume is not a growth strategy anymore. Signal is.
The practical consequence for your reporting: a post with 80,000 impressions and zero sends loses to a post with 9,000 impressions and 300 sends every single time. If your weekly report still leads with reach and follower count, you are measuring the past. In the rest of this guide — a companion to our guide to private communities and DMs in 2026 — we rebuild the metric stack around the actions platforms actually reward.
2. The Three Signals That Now Decide Reach
In his 2026 ranking series, Mosseri confirmed the signals that carry the most weight, and they are refreshingly few. Per Buffer's October 2026 algorithm guide, three actions dominate:
1. Watch time — did people actually finish the video? Retention trumps autoplay. The algorithm treats a completed 20-second clip as a stronger endorsement than a tap-liked photo.
2. Likes per reach — not total likes, but what share of the people who saw the post liked it. This normalizes a post's resonance regardless of how big or small the account is, which is exactly why small accounts get discovered.
3. Sends per reach — how often viewers share the post to a friend through DMs. The newest and, for discovery, the most powerful of the three.
Two nuances matter. First, the ranking systems are split: one ranks content from accounts you follow, another ranks recommendations from accounts you don't. Likes count slightly more for keeping your existing followers; sends count slightly more for reaching new people. Your goal metric therefore depends on the growth stage you are in. Second, recency is back with teeth: a growing share of each day's impressions goes to posts under 24 hours old, so the first day of a post's life matters more than it used to.
Instagram has also been explicit about originality since April 2026, reducing reach for aggregator accounts that mostly repost other people's content. Original creators now get the distribution advantage, and the share of impressions going to original content has risen sharply. Combined with the sends signal, that tells you exactly what to do: publish your own work and make it so useful that one person sends it to another. We covered this dynamic from the audience side in why conversations beat views.
3. Sends Per Reach: The Metric That Unlocks New Audiences
Let's define the star of 2026 precisely: sends per reach = the number of times people shared your post via DM ÷ the number of accounts that saw it. A 5% sends-per-reach rate means one viewer in twenty passed your post to a friend — a personal recommendation at scale that no ad budget can buy.
Why do platforms weigh DM shares so heavily? A send is the most expensive engagement action available. It costs social currency: the sender is staking their relationship on your content being worth the interruption. A like is private feedback to the machine; a send is a public act of trust between two humans. If you want the full picture of where those sends land and why DMs are the new feed, we wrote that playbook earlier this month.
What earns a send is not randomness. The most-shared content tends to do one of four things:
- Solves a specific problem so well the sender looks smart for sharing it (checklists, frameworks, price comparisons).
- Gives the sender words for a feeling they couldn't articulate ("this is exactly what happens in our team").
- Speaks to a niche identity strongly enough that sharing it says something about the sender.
- Is genuinely funny or surprising in a way that needs a witness to be fully enjoyed.
Notice what is missing: product announcements, award posts, and generic inspiration quotes. If your last 10 posts would not make you forward them to a colleague, your sends-per-reach will stay near zero regardless of production budget. And the people who send your content are not always your followers — which is exactly why nano-influencer partnerships compound so well in 2026: small creators with high-trust audiences generate the sends that big accounts can no longer fake.
4. Reach vs Engagement: Choosing Your Format on Purpose
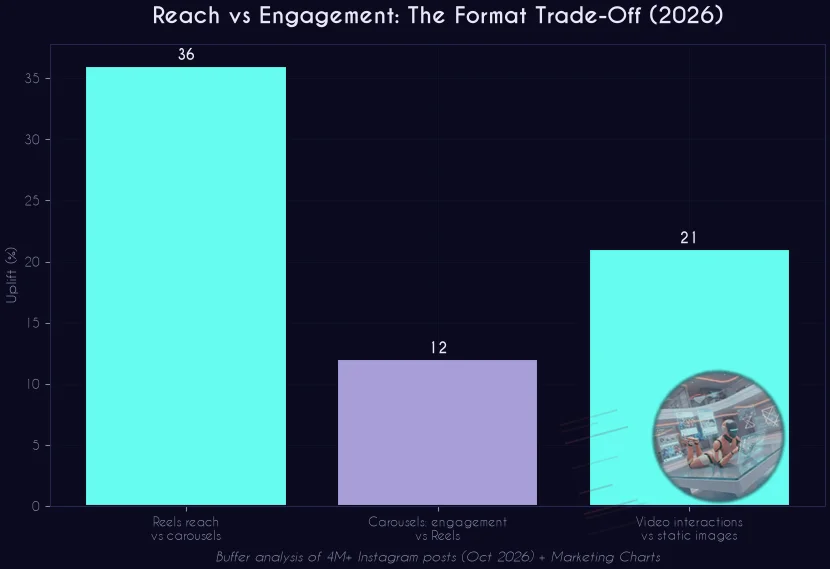
Every post is now a portfolio decision: do you want new eyeballs or deeper relationships? Buffer's analysis of 4M+ Instagram posts quantifies the trade-off cleanly. Reels earn about 36% more reach than carousels, but carousels get about 12% more engagement than Reels. Meanwhile, video formats on Instagram still generate roughly 21% more interactions than static images, per data reported by Marketing Charts.
The strategic read: use Reels to recruit and carousels to convert. A Reel's job is to earn a watch-through and a send from a stranger; a carousel's job is to earn saves and repeat visits from the people you just met. Neither is "better" — they do different jobs in the same funnel:
- Reels: cold-audience recruitment. Front-load a hook in the first 2 seconds because watch time is the gate.
- Carousels: depth and saves. Slide 1 is a promise; the last slide is a summary people screenshot.
- Static images: now the weakest organic format for interactions — reserve them for announcements or ultra-strong single ideas.
- Stories: not a reach play at all. Their ranking listens to DMs, replies, and closeness — they deepen relationships with existing followers.
One more 2026 mechanic worth knowing: Instagram "auditions" posts from small public accounts by showing them to non-followers first, then keeps pushing the ones that perform — so a well-made post can break out days later. Your only job in that audition is a clear hook plus a shareable payoff. Angry or spammy reporting does nothing; the models ranking your content are bigger and less hackable than ever.
5. The 2026 Metrics Dashboard: What to Track Weekly
Here is the dashboard Purple Crib Studios now runs for social clients across the US, UK, UAE, Canada, and Nigeria — five lines, no vanity metrics:
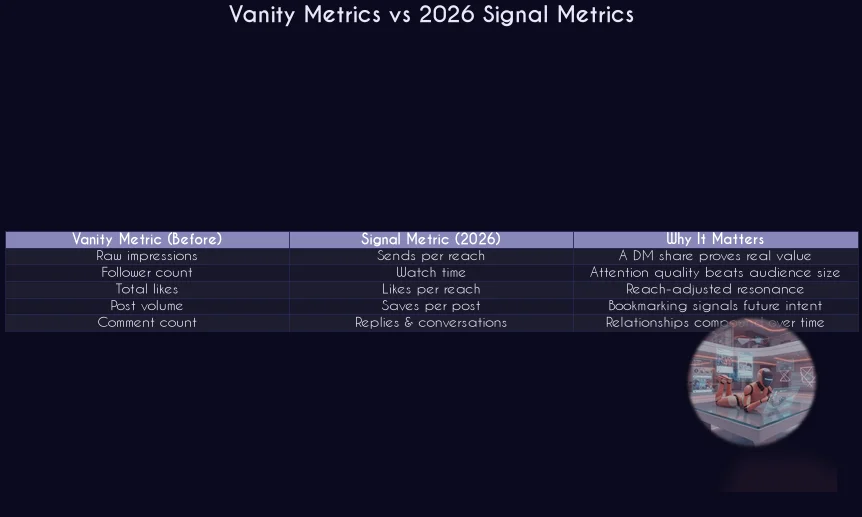
Why drop impressions entirely? Because reach without a denominator invites the wrong behavior — chasing big-audience topics instead of share-worthy ones. Reach still appears in your metric definitions, but always as the denominator (per reach, per view), never as the headline number. The same logic applies to follower count: it is an input you influence indirectly, not an output you report on weekly.
6. The Signal-Over-Frequency Content Playbook
The single biggest 2026 lesson: one post worth sending beats ten posts worth scrolling past. Publishing volume can even hurt you when filler dilutes the average value per post. Here is the weekly operating rhythm we run:
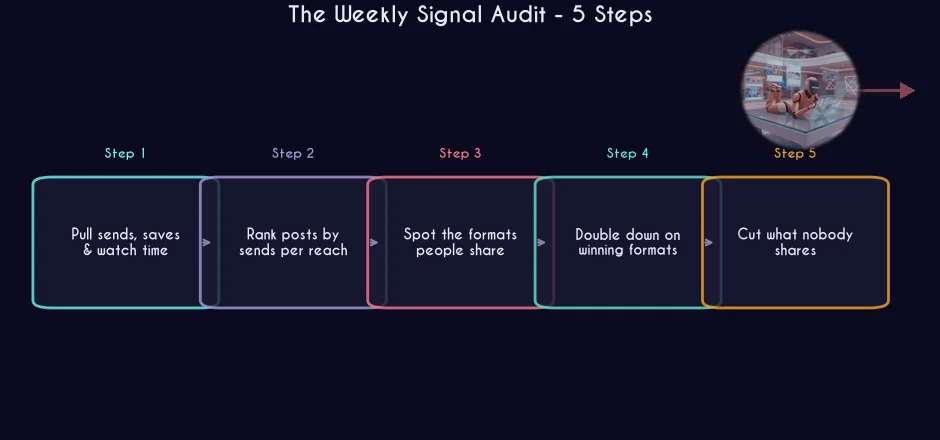
In practice that audit looks like this every Monday:
- Pull the four numbers for last week's posts: sends, saves, watch-through %, likes per reach.
- Rank every post by sends per reach. The top of this list is your growth engine, regardless of what it was about.
- Extract the WHY. Which topic, hook style, and format did the winners share? Look for the pattern behind the pattern.
- Commission 2 experiments that double down on the winning pattern in different formats (a winning carousel topic becomes a Reel; a winning Reel hook becomes a carousel deep-dive).
- Retire the bottom 20% of formats and topics without sentiment. Filler is not neutral — it trains the algorithm (and your audience) that your account is skippable.
Two supporting moves multiply the effect. First, make sending effortless: every useful post should end with a "send this to someone who..." line that names the exact person the post is for. Second, arm your DMs — a surprising share of high-sends posts lead to DM conversations, and you need fast, trackable links there. Our free WhatsApp link generator builds clean, trackable wa.me links (with QR codes) for exactly that handoff, whether your audience is in Lagos, London, or Dubai.
7. 90-Day Signal-First Roadmap
Here is how the transition looks in three phases if you are moving from a volume dashboard to a signal dashboard:
- Days 1-30 — Baseline. Stop reporting total likes. Set up the five-metric dashboard. Tag every post by format and topic. You are not changing strategy yet — you are learning what your audience already does with you.
- Days 31-60 — Prune. Cut posting frequency by a third and reinvest the hours in production quality. Kill any format that has not earned a single send in 4 weeks. Rewrite hooks to the first 2 seconds / first line. Original content only — no aggregator reposts.
- Days 61-90 — Compound. Double down on the top sends-per-reach pattern. Systematically convert winners across formats (Reel ↔ carousel). Add one community element per week — a conversation starter, a DM invite, a question sticker — because replies and relationships are the moat that algorithm changes cannot take away.
Brands that run this roadmap typically see their first clear sends-per-reach leader emerge by week 5, and the compounding phase by week 9. The reason is boring and beautiful at once: you are no longer fighting the algorithm for reach — you are feeding it the exact evidence it was built to reward.
8. Quick Wins Checklist
Start with these on Monday morning:
- ✅ Add "sends ÷ reach" as a column in this week's content report — you cannot manage what you do not measure.
- ✅ Rewrite your last 3 scheduled posts around one question: "would someone send this to a colleague?"
- ✅ Add a "send this to someone who..." line to every educational post from now on.
- ✅ Convert your best-performing carousel into a 25-second Reel with the same hook.
- ✅ Delete or archive recurring filler formats that have never earned a send.
- ✅ Check that every post is original — aggregator reposts have carried a reach penalty since April 2026.
- ✅ Post at your audience's peak-recency window and expect the first 24 hours to decide distribution.
- ✅ Track saves per post and watch-through %, not totals — denominators or it did not happen.
The 2026 metric stack is simpler than the one it replaced: watch time, likes per reach, sends per reach, saves, and conversations. Report on those five lines, prune the volume, and the reach you used to chase starts arriving on its own. That is the whole game — and the brands that reorganize their dashboard this quarter will spend 2027 compounding while everyone else keeps counting scrolled-past impressions.
📊 Want a Signal-First Social Audit?
Send us your handle. Within 48 hours, Purple Crib Studios will show you your true sends-per-reach leaders and the 3 formats you should double down on — free.
💬 Get Your Free AuditRather Have Experts Handle This?
Purple Crib Studios offers done-for-you Social Media Marketing across the US, UK, UAE, Canada, and Nigeria. Get a free 5-point audit in 48 hours.
Explore Our ServicesFAQs
What is sends per reach in 2026?
Sends per reach is the number of times viewers shared your post via DM divided by the number of accounts who saw it. Instagram's Adam Mosseri has confirmed it is one of the three highest-weighted ranking signals in 2026, and it matters more than likes for reaching non-followers.
Which social media metrics should I stop reporting?
Stop reporting totals without denominators: raw impressions, total likes, follower count, and post volume. They describe exposure, not effectiveness. Replace them with sends per reach, likes per reach, watch-through rate, saves per post, and replies per week.
Do likes still matter in 2026?
Yes, but only as likes per reach, and mainly for content shown to your existing followers. Mosseri has confirmed likes carry slightly more weight when ranking for followers, while sends via DM carry slightly more weight when ranking content for people who do not follow you yet.
Are Reels or carousels better for growth right now?
Buffer's 2026 analysis of 4M+ Instagram posts found Reels earn about 36% more reach than carousels, while carousels earn about 12% more engagement than Reels. Use Reels to recruit new audiences and carousels to deepen the relationship with saves and repeat views.
Does posting more often hurt my reach?
Volume itself is not penalized, but filler dilutes your results. The 2026 approach is signal over frequency: one post people actually send beats multiple posts people scroll past. A growing share of each day's impressions also goes to posts under 24 hours old, which rewards quality over quantity.
How long does it take to see results from signal-first social media marketing?
Most brands we run the 90-day roadmap with see a clear sends-per-reach leader emerge around week 5 and compounding growth by week 9. The first month is pure baseline measurement, so do not judge results until your dashboard has at least four full weeks of the five core metrics.
Test Your Knowledge — Social Media Metrics Quiz
10 quick questions based on this article. Tap an answer to see if you got it right.
Enjoyed this? One click tells Google to show you more Purple Crib content in Search.
Add on GoogleSources & Further Reading
- Buffer — How the Instagram Algorithm Works: Up-to-Date 2026 Guide
- Instagram (Adam Mosseri) — Shedding More Light on How Instagram Works
- HubSpot — The State of Marketing 2026
- Sprout Social — Social Media Statistics
- Marketing Charts — Social Media Platform Engagement Data
#SocialMediaMarketing #SendsPerReach #InstagramAlgorithm2026 #SocialMediaMetrics #SignalOverFrequency #WatchTime #SocialMediaStrategy #ContentMarketing #DigitalMarketing #InstagramGrowth #MarketingAnalytics #SocialMediaKPIs #BrandGrowth #VanityMetrics #PurpleCribStudios